
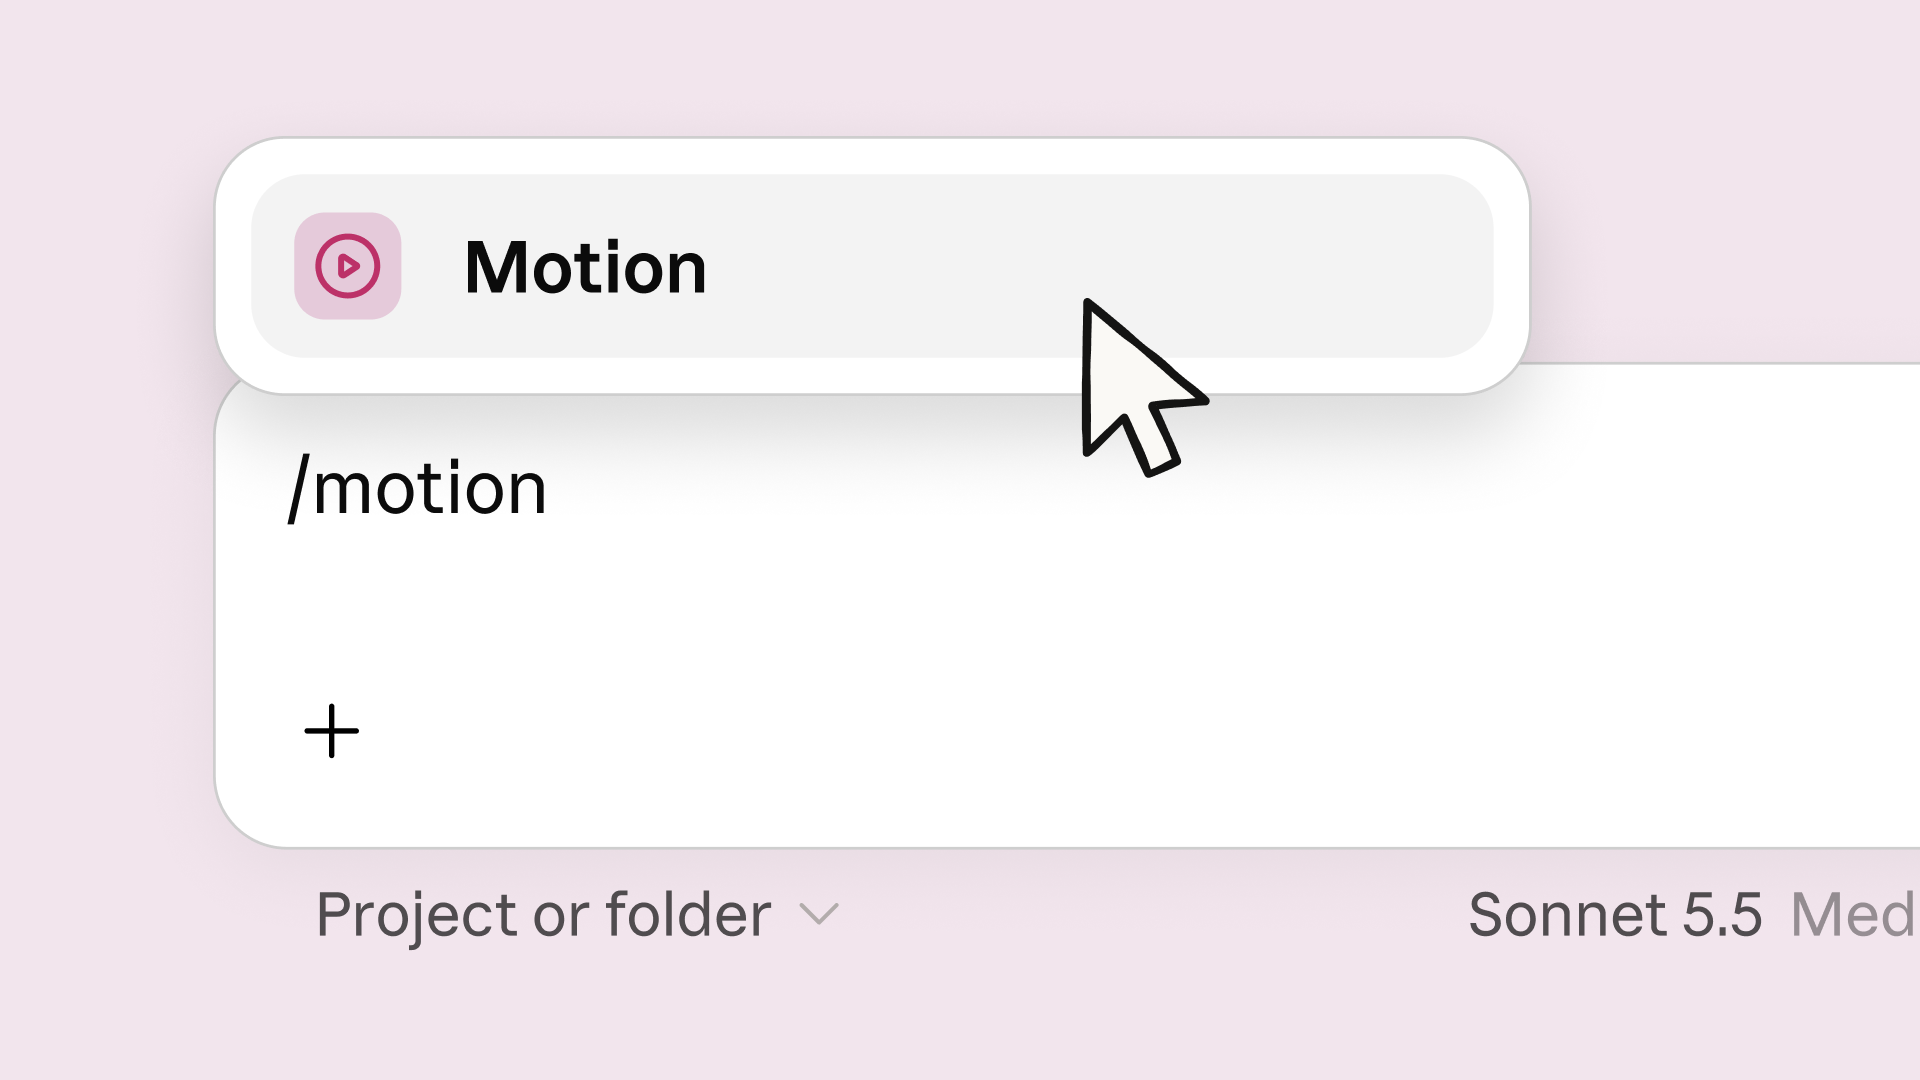
Anthropic has released two new tools in beta within Claude. Dashboards builds live dashboards from company data in Amazon Redshift, BigQuery, ClickHouse, Databricks, Snowflake, and Salesforce, showing the SQL query and last update time under each chart. Motion creates animations via the /motion command: they are generated not by a video model, but as editable code, so any word and number can be manually edited. In parallel, Docs, Slides, and Design have exited beta and become available on all Claude plans.
What happened
Anthropic opened beta access to two new tools within Claude. Dashboards connects to corporate data stores Amazon Redshift, BigQuery, ClickHouse, Databricks, Snowflake, and Salesforce and builds live dashboards where you can see under each chart which SQL query generated it and when the data was last updated. Finished panels are passed to Amplitude, Grafana, Hex, Mixpanel, Omni, PostHog, Sigma, and Perplexity; Looker, monday.com, and Tableau connections are promised later. The tool is available on paid plans. The second tool, Motion, is launched with the /motion command and generates animation not by a video model, but as editable code; the result is exported to MP4 and opens in Adobe, Descript, HeyGen, Higgsfield, invideo, Luma AI, and Runway, but is only available on Team and Enterprise plans.
Context
The release continues Anthropic's platform shift: Claude is gradually ceasing to be just a chatbot and is becoming a workspace. The first step was content tools — Docs, Slides, and Design: more than 45 million documents, presentations, and designs have already been created in Claude, showing the platform's real audience. Now it is moving further — to corporate data and explanatory graphics. The positioning of Dashboards is also telling: Anthropic offers Claude as a generation layer on top of the existing analytics stack, not a replacement for it — results go to the analytics services familiar to teams. This choice reduces the sharpness of a head-on conflict with classic BI platforms right now.
Why this matters for the industry
For the industry, the main signal is the transformation of Claude into a BI environment: questions to corporate data in natural language without writing SQL or IT tickets. This is direct competition with classic BI platforms, and it blurs the moat of "thin" Text-to-SQL wrappers and simple analytics tools. Technically, the most substantive element of the release is observability: the generated SQL query and update time are visible under each chart, so the "trust as a feature" pattern sets the vector for the entire Text-to-SQL category, although this is currently about visibility, not guaranteed correctness. The Motion approach is a second independent pattern, "code as media": animation is written in code, not by a diffusion video model, hence determinism, manual editing of any word, number, and timing, and the absence of AI artifacts and generated people. BI vendors with copilot functions and other labs will almost certainly have to reproduce the "chat + storage + visible query" combination, and the growth of real Text-to-SQL cases on corporate schemas will increase pressure on Anthropic to publish accuracy metrics.
Why this matters for users
If you have a paid Claude plan, you can try Dashboards right now: connect a corporate data store, ask to build a dashboard in chat, and before making decisions based on numbers, check the SQL query under each chart. Motion is launched with the /motion command, but only on Team and Enterprise plans. Docs, Slides, and Design have exited beta and are free on all plans, including Free, and export to PowerPoint, PDF, and Google Slides preserves document formatting. A separate action is required for those who used the standalone claude.ai/design site: it will close on December 14, and its chats, comments, and public links will not be automatically transferred — they need to be saved in advance.
What is still unknown / limitations
The release is in beta: Anthropic has not disclosed usage prices, latencies, limits, and API, and the stated capabilities are not supported by benchmarks or evaluation methodology. SQL query visibility provides an audit, but does not guarantee semantic correctness: a schema hallucination, incorrect aggregation, or filter may go unnoticed if the query looks plausible. Looker, monday.com, and Tableau connections are only announced, the actual accuracy of generated queries on specific corporate schemas has not yet been measured, and on the Enterprise plan new features are disabled by default. Until independent measurements, comparisons with the classic BI stack remain interpretation, not a measured fact.
Sources
- Official Anthropic announcement: Build live dashboards and animate explainers with Claude
- Discussion of the release on Hacker News
Author
Look at AI, editorial team